Geographic information system support

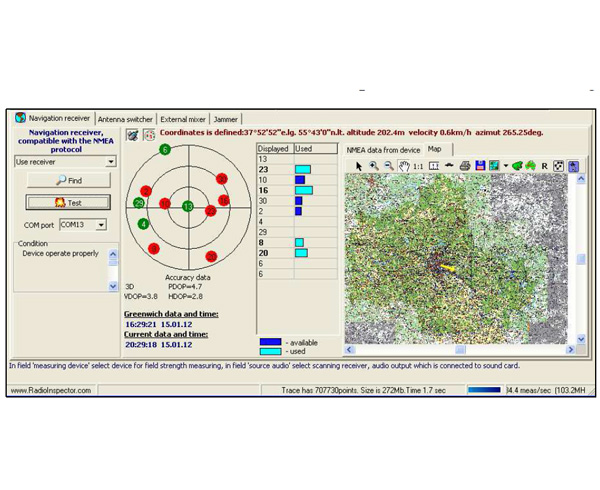

The use of geographic information system
If the measuring system includes a GPS receiver then the geographic coordinates of the
measurement location can be saved in a panoramas database along with the measurement results.
Further analysis of the measurements results can be performed in the frequencyamplitude-time and geographical coordinates.
In the postprocessing the different presentations of measurements’ results (graphical, tables, symbolic,
geographic) are connected to each other: changes data in one of the tables or graphs leads to a
corresponding change the data in the other forms of the presentation. This allows performing the comprehensive
analysis of the collected data: to make a decision about radio communication quality, predicting radio coverage area,
to search the interference sources, to detect unauthorized radio signals sources, etc.
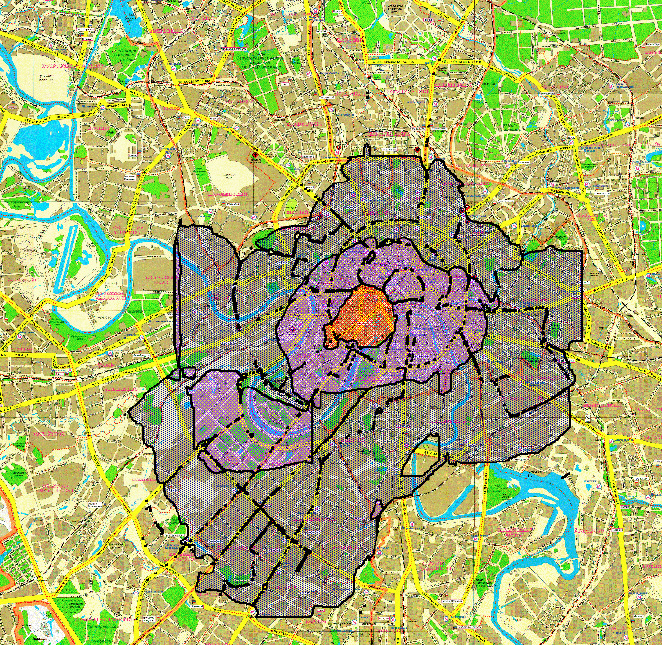
Wide opportunities of the measurements results presentation on a map allow selecting the areas with critical
field strength (too big or too small).
Showing the results of amplitude direction finding
Amplitude direction-finding is one of the most simple, straightforward and least expensive
methods of the radiation source locating. In the absence of objects which cause rereflection, the
amplitude direction-finding accuracy is comparable to the other types direction-finding accuracy.
At the high frequencies (above 3 GHz) and during direction-finding of wideband radiation
sources the amplitude direction-finding may be the only method to determine the coordinates of
the transmitting station.
To obtain the direction-finding bearing it is enough to have a directional antenna and a
magnetic compass. As an example, Yagi TV antenna in the frequency range 40-900MHz, dipole, log-periodic or
horn antenna can be used as a directional antenna.
Bearings can be obtained from 3 or more points located at the maximum possible distance
from each other. The coordinates and magnetic azimuth bearing (direction on
maximum radiation of a magnetic compass) of measuring point are recorded at each point of
measurement.
The results of direction-finding are displayed on electronic map the program takes into account
the value of the magnetic declination when calculating the cross-points.
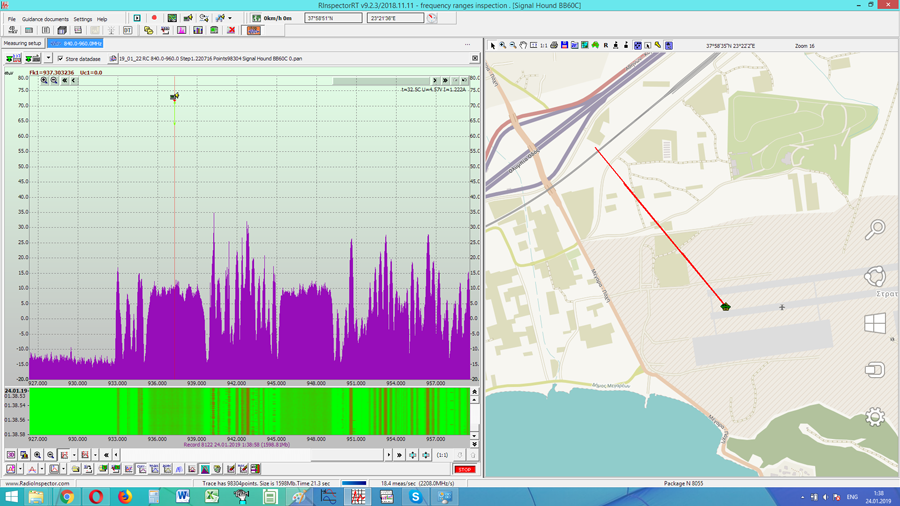
Measurement of field strength and signal/noise ratio by mobile measuring complex, mapping the distribution of the electromagnetic field and radio coverage area rating
One of the practically important tasks is to study the different areas of radio availability of different radio communication devices.
This task can be solved by mobile radio control system measurements, processing the measurement results and displaying on the
electronic map.
Using special algorithms for processing measurement results can highlight on the electronic map the areas with varying field
strength and signal/noise ratio. Special data processing algorithms which implemented in the RadioInspectorRP program and applied
filters selected by time and distance travelled allows presenting very accurate data obtained in an urban environment where is the strong
amplitude fading, multipath and interference.
Radio coverage areas calculated on the mobile radio monitoring results are the result of empirical
research and can adjust theoretical calculations during network designing.
Get In Touch or Make Your Order!
Please, feel free to send us all questions you have about RadioInspector: